
Types of Architecture Diagrams
Diagrams and visual sketches help architects as we communicate our designs and roadmaps. But they also help architects to think through a design, to explore dependencies, and to create better designs – architects often call these “future-states”.
Some architecture diagrams can be quite simple, showing how applications support capabilities, or provide an overview of technology interfaces or data architectures.
Others diagrams describe workflows: business process diagrams or sequence diagrams.
Architecture diagrams are much more than just visuals or images. They are valuable tools which help to:
- Translate complex concepts: providing an understanding of how people, processes and technology interact and work together
- Guide strategies and projects: set out a clear roadmap for projects and transformation, ensuring alignment and focused execution
- Inform Decisions: serve as a data-driven foundation for decision-making and optimizing resource allocation
While some architecture diagrams are specifically designed for conveying technical information, many are easy for business users to navigate.
For instance, the Graph View visualization in ABACUS allows anyone to navigate through relationships between strategies, capabilities, applications, and technology infrastructure with simple clicks, making architecture and technical content accessible.

Graph View for navigating through architectures in ABACUS
Enterprise Architecture Best Practice: Data-Driven Diagrams
More data-driven enterprise architecture diagrams are also becoming essential tools for architects and digital business managers. These diagrams provide a concise way to visualize the relationships between components of an enterprise architecture.
Diagrams sketched out using canvas-and-stencil or drag-and-drop tools, can be enriched with cost data or technical data, pulled in from integrations or via API.
When architects can roll data up across the layers of the architecture using analysis tools, they can build a set of financial and technical metrics which support well-informed decision making in their business.
Enterprise Architecture Diagram Examples
Many architects find it useful to add information and detail beyond black and white box-and-line diagrams.
There are a number of ways to do this. Below we give an overview of some options.
Adding Color to Architecture Models & Diagrams
Color can be used to help group or show common classes of elements.
Or architects can use colors to create a simple architecture roadmap. For instance, Red-Amber-Green to indicate what is changing in a technology landscape diagram or a business capability map.
Colour can also be used to indicate a metric such as Retain-Redesign-Refresh-Retire or Tolerate-Invest-Migrate-Eliminate.
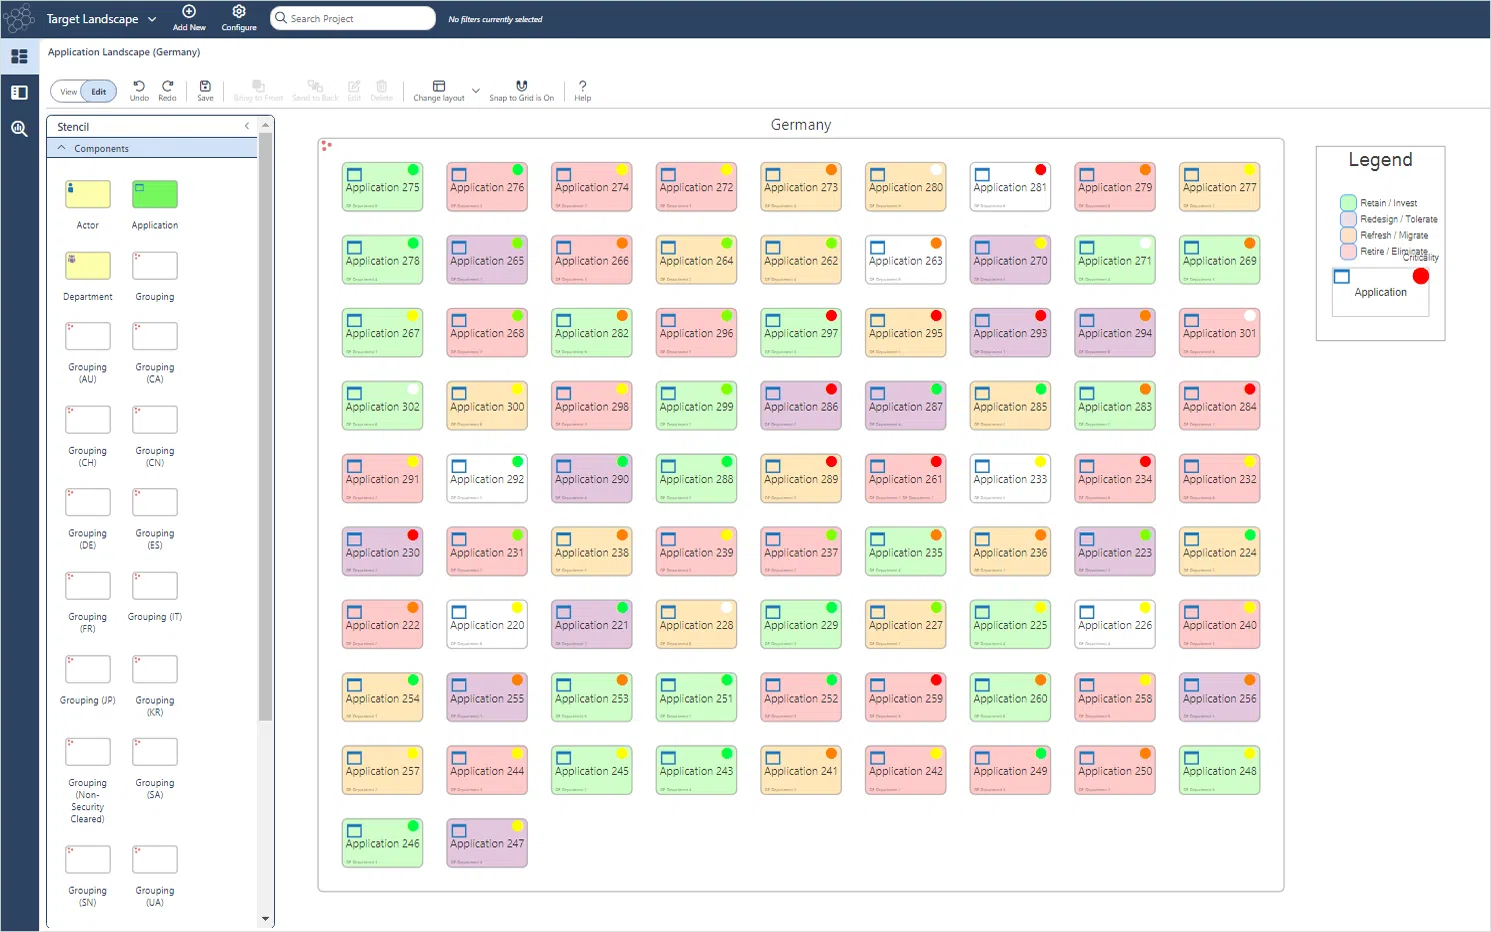
Architects can also use color to draw attention to strategic concerns such as highlighting where spend or investment is high.
Architecture Diagram Icons & Frameworks
Architects often prefer to use standard modeling languages to express well-understood technical or business concepts.
Popular standards include UML, BPMN, ArchiMate, and also cloud iconography such as AWS and Azure icons.
Check if your tool supports these languages, as many free tools and less mature tools provide only basic box-and-line diagramming, and some tools don’t offer drag-and-drop diagramming functionality at all.
Enterprise Architecture Diagram Annotations
Diagram annotations can be used to surface important additional details such as:
- Name
- Type
- Property Value
- Attached Components
- Timestamps
- Cost data
- Criticality Ratings
- Risk Scores
So, if you look at a diagram, you will to be able to see relevant property values at a glance.
Many of these may be text descriptions, or cost values. Other examples of useful architecture diagram annotations include color markers which indicate ratings such as criticality scores or risk scores.
Details such as platform services, app language and other recommendations can also be included.
Additional relevant properties can be pulled in from external sources via API, pre-populating annotations and saving time and effort. Architects often get a quick start building out diagrams by using lists of properties appropriate for their industry or project from popular standards and frameworks.
In this way, diagrams can provide rich detail which enhances detailed technical discussions. With appropriate permissions, users are also able to edit these values to ensure the diagram stays up-to-date.
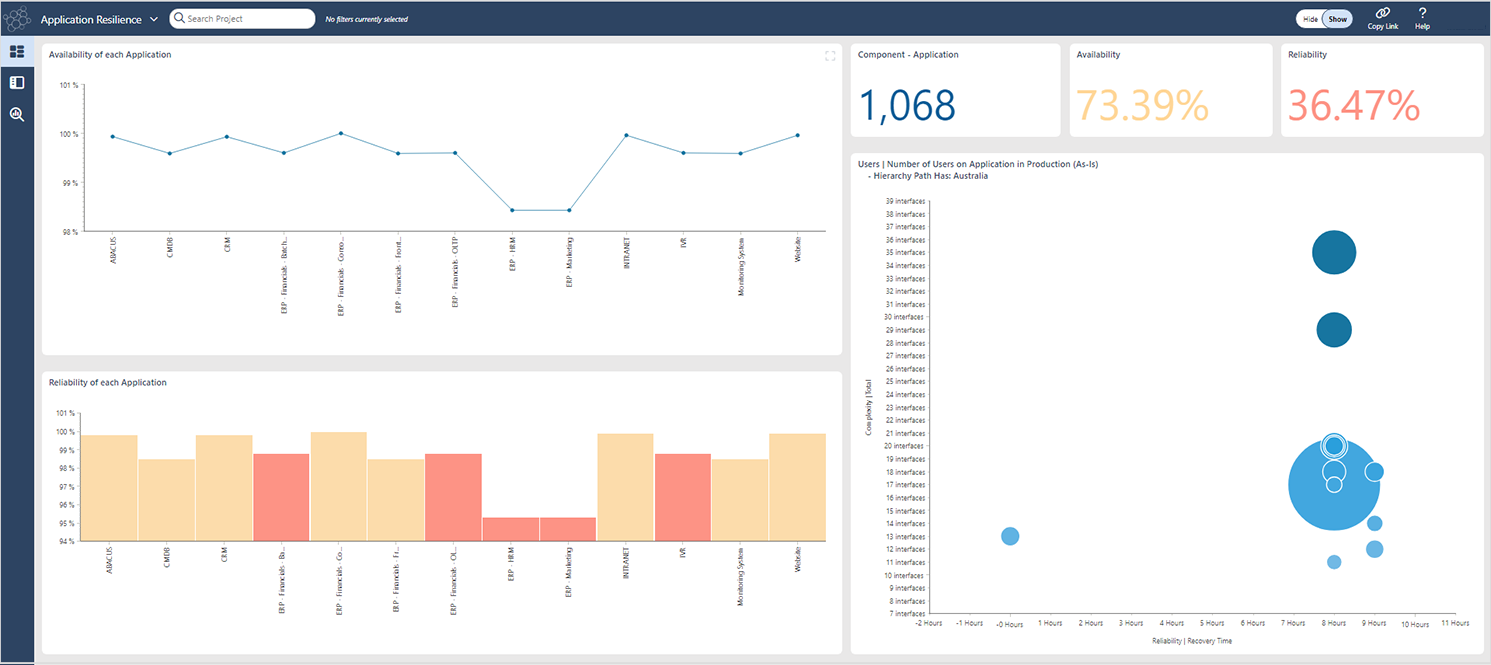
Data Driven Architecture Diagrams
Diagrams can also provide access to data-driven insights.
In ABACUS, architects can run analysis on the relationships between components to provide answers to questions such as:
- How many processes use this application?
- How many users rely on this process or application?
- What is the availability and reliability of our applications?
Answers can then be indicated on the diagram using icons, text, charts, or numeric values.
A Comprehensive Enterprise Architecture Diagram Toolkit?
Of course, diagrams are only part of an enterprise architect’s toolkit.
Also key (and ideally fully integrated with strong diagramming functionality) are a well-crafted enterprise architecture repository, with efficient integrations and automations. Control over user permissions is also important for governance and security in large enterprises. Analytics capabilities are needed to generate the metrics and KPIs that keep stakeholders informed and guide the business towards its goals.
Architects and digital business managers benefit from a comprehensive toolkit which offers a range diagramming techniques and design options.