
What Are Enterprise Architecture Diagrams?
Architects use diagrams to understand and improve systems. These visual guides such as data flow diagrams, application architectures, or process models, help us communicate and plan our business strategies.
Architects use them day-to-day to explain how to streamline portfolios or workflows, to save time, money and resources. Here we explore examples of IT architecture and enterprise architecture diagram types, and how diagrams can help your teams make progress towards your goals.
How to Create Enterprise Architecture Diagrams
Your architecture diagram should show how the components of your solution fit together and how they relate to each other for functionality. You should also be able to link in upstream and downstream information to capture and visualize technology dependencies, map risks and policy controls, and highlight critical relationships.
If your team wants to improve a key process that’s important for your product or service, you might wonder: “What areas of the approval process can speed up service patches?” or “How does the transfer time between databases and applications impact our revenues?”.
This analysis can be assisted with a diagram that describes each business process. You can also link the process in question with other datasets to answer questions such as:
- “Which parts of the organization supports this process?
- “Which applications support this process?”
- “Do we have the right infrastructure in place to support this process?”
Benefits of using an enterprise architecture diagram include:
Clearer Conversations: Instead of debating individual points of view, technical and non-technical team members can discuss concepts and dependencies based on a visual reference. This supports better discussions and decisions. Diagrams also provide a common language for all team members to use.
Roadmapping Change: By editing the diagram to visualize a new target state, teams plan step-by-step changes. These roadmaps for change make adapting to new strategies clearer and more manageable.
Signature-Ready Reports: Diagrams can reliably capture a proposal or plan for records and compliance purposes. They also accelerate the approval and sign-off process.
Diagram Examples: Applications, Capabilities, Technology
Architects have developed a range of standard enterprise architecture visualization templates to assist in describing common viewpoints. Some of the most popular include:
Application Architecture Diagrams: These blueprints detail how software components work together and how they interact with the organizations’ IT landscape.
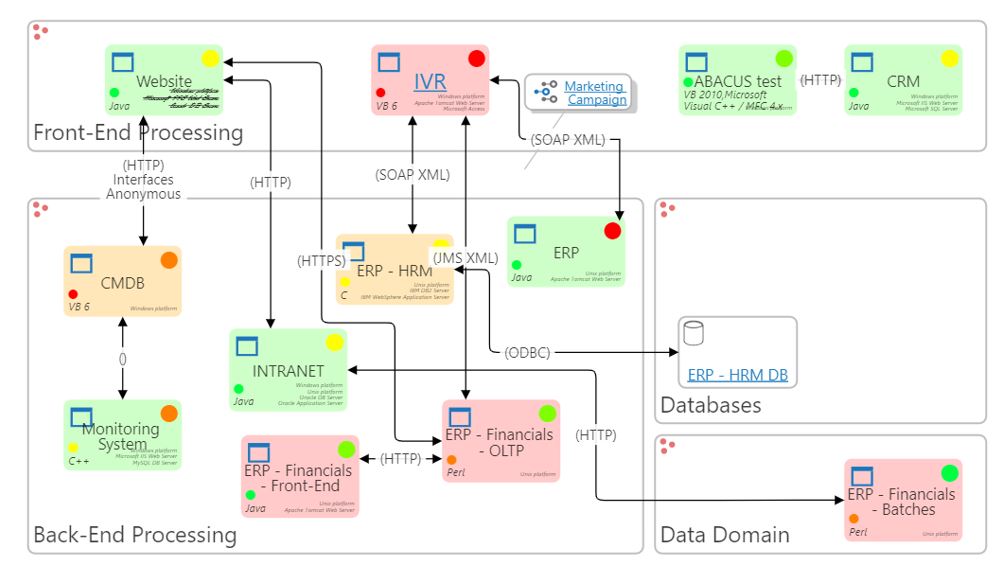
Application Interface Diagram in ABACUS Enterprise Architecture Tool
Technology Architecture Diagrams & Enterprise Infrastructure Diagrams: Illustrate your tech stack, giving you a detailed view of the technologies powering your business.
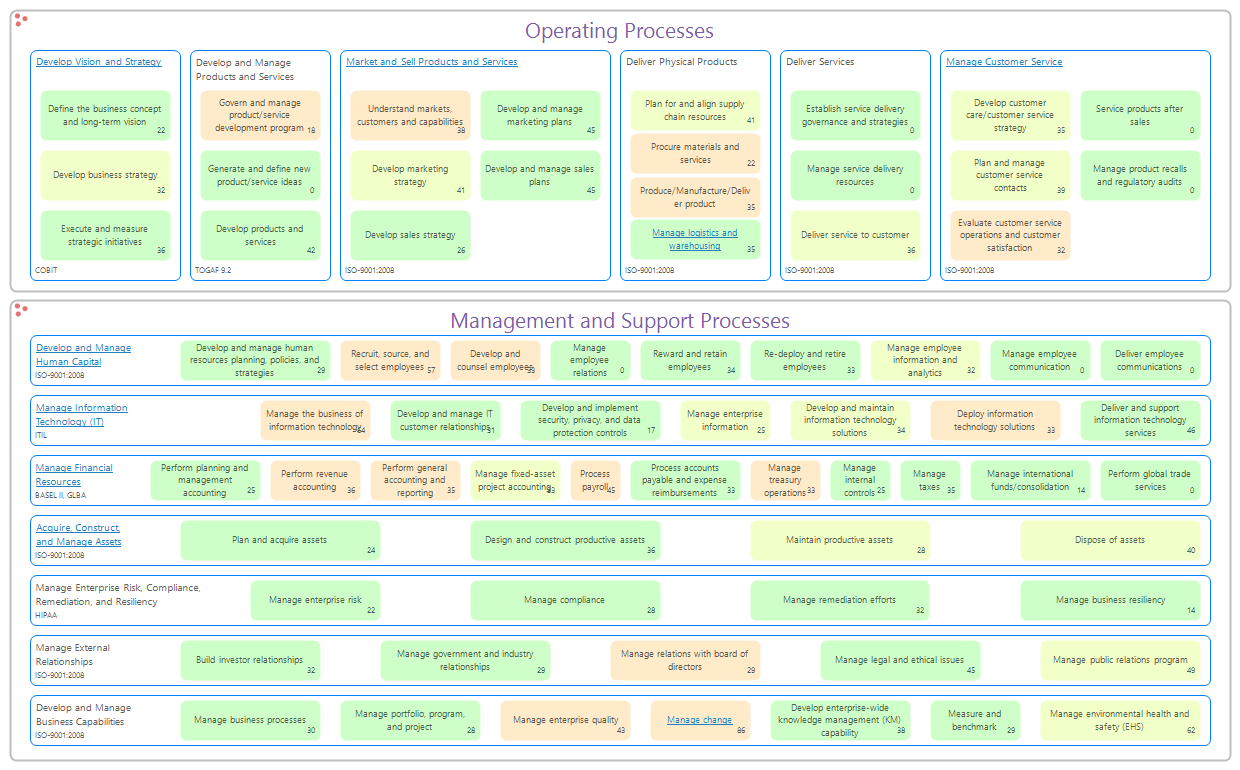
Capability Maps & Value Streams: Business capability maps provide a “building blocks” visual of business functions. They help to keep business and IT aligned, so all stakeholders can be on the same page
Cloud Architecture Diagrams: Display your cloud setup, helping teams design and document the enterprise’ cloud infrastructure, and manage resources and costs.
![]() Building AWS architecture diagrams in ABACUS
Building AWS architecture diagrams in ABACUS
Solution Architecture Diagrams: Are used to design the structure, interfaces, and integration points of a solution or system. They help teams make informed decisions about function, technology choices and dependencies.
Information Architecture Diagrams: Show the information assets data flows, and data stores. For instance, Entity Relationship Diagrams show data entities and their relationships.
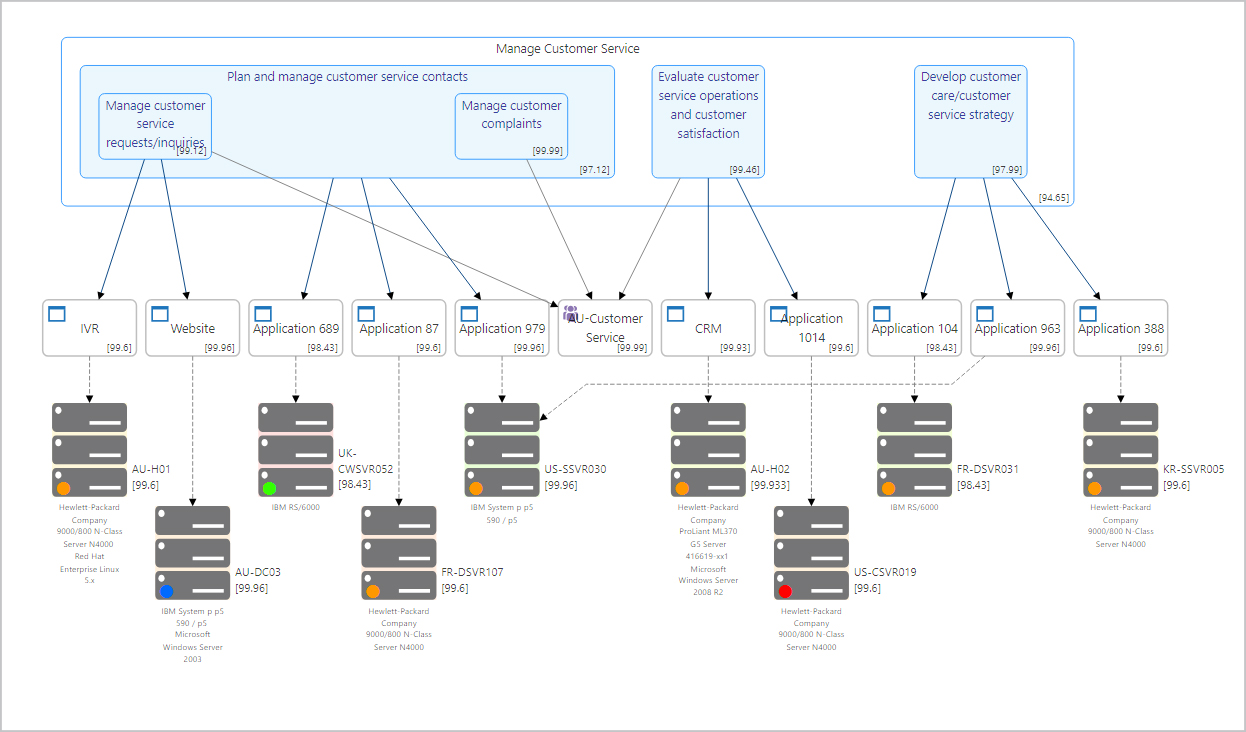
Enterprise Architecture Data Flow Diagram / Data Architecture Diagrams: These diagrams show how data moves through various processes, systems, and components in your organization. They can be helpful in revealing dependencies and bottlenecks and when implementing access controls and data protection measures.
Business Process Models, Flowcharts & Workflow Diagrams: Illustrate and guide teams through a process from start to finish. They assist in highlighting key decision points and in streamlining operations. Web-based BPMN notation process modeling is available in ABACUS.
Business Architecture Diagrams & Business Transformation Diagrams: Diagrams which capture business vision and goals, and diagrams which track the journey of transformative projects, ensuring resources are used effectively. Business Motivational Model (BMM) and Business Model Canvas are popular options.
Organization Charts: Display the roles and hierarchy within your organization. Additional details such as the underlying costs associated with a business unit can be rolled up and indicated using color.
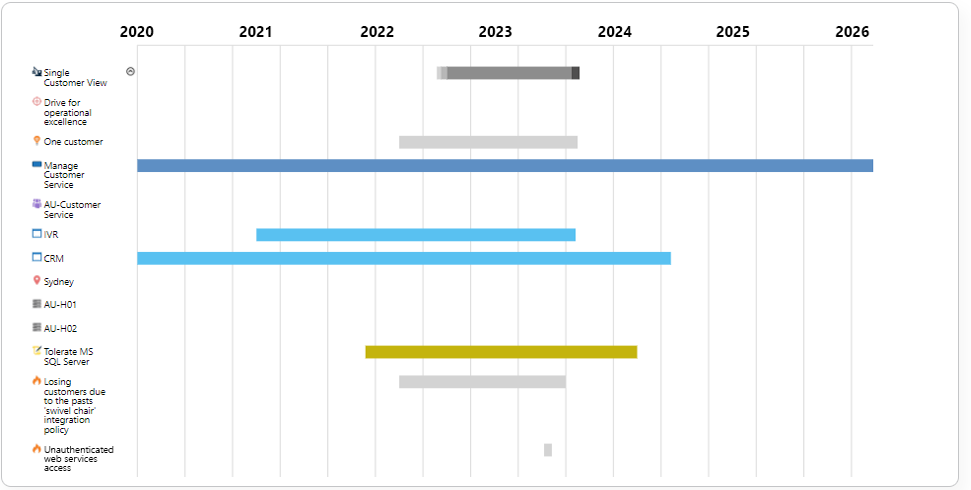
Gantt Charts and Roadmaps
Enterprise architecture tools should also allow you to link diagrams, viewpoints and other data. Architects and other users can then then drill down from a capability map to the technology that enables or supports each capability. Then the tech stack can be further unpacked with a Gantt chart, to show the lifecycle dependencies of applications using the technology and to plan for the roadmap.
Best Enterprise Architecture Diagramming Tool Features
To get the most out of your diagrams, make sure your team are able to store and edit diagram components from a central repository/single source of truth. If diagrams are stored in individuals’ PowerPoint, Visio or Sparx files, it’s hard to know where to go for an authoritative source, and they become difficult to maintain. If a diagram isn’t integrated and connected to real-time data in your repository, it may be out of date before the next meeting.
Using ABACUS, updates to diagrams are inherited. So, as users draw diagrams and add annotations they are building out the underlying repository, adding components and connections to that dataset. Any changes made by stakeholders – such as application owners updating an application catalog – also dynamically reflect in the diagram, ensuring it remains up-to-date. For busy EAs this can save hours and days of time and effort.
The benefits of this approach include:
- There is no need to redraw or update Visio, PowerPoint, Sparx or Lucid diagrams each time a component in your dataset changes
- Diagrams can also be created automatically from structured data in your database
Documenting Architecture & Change Efficiently
When organizations visualize their architecture and processes, they make it easier for teams to work together to improve operations. Using different types of diagrams, such as application and technology architectures, your team can can map out your technology estate. You can use a range of viewpoints to understand how elements are linked or depend on each other and plan business change with confidence. ABACUS provides a wide range of industry standards, icon libraries and templates to get started quickly with enterprise architecture diagrams and projects.