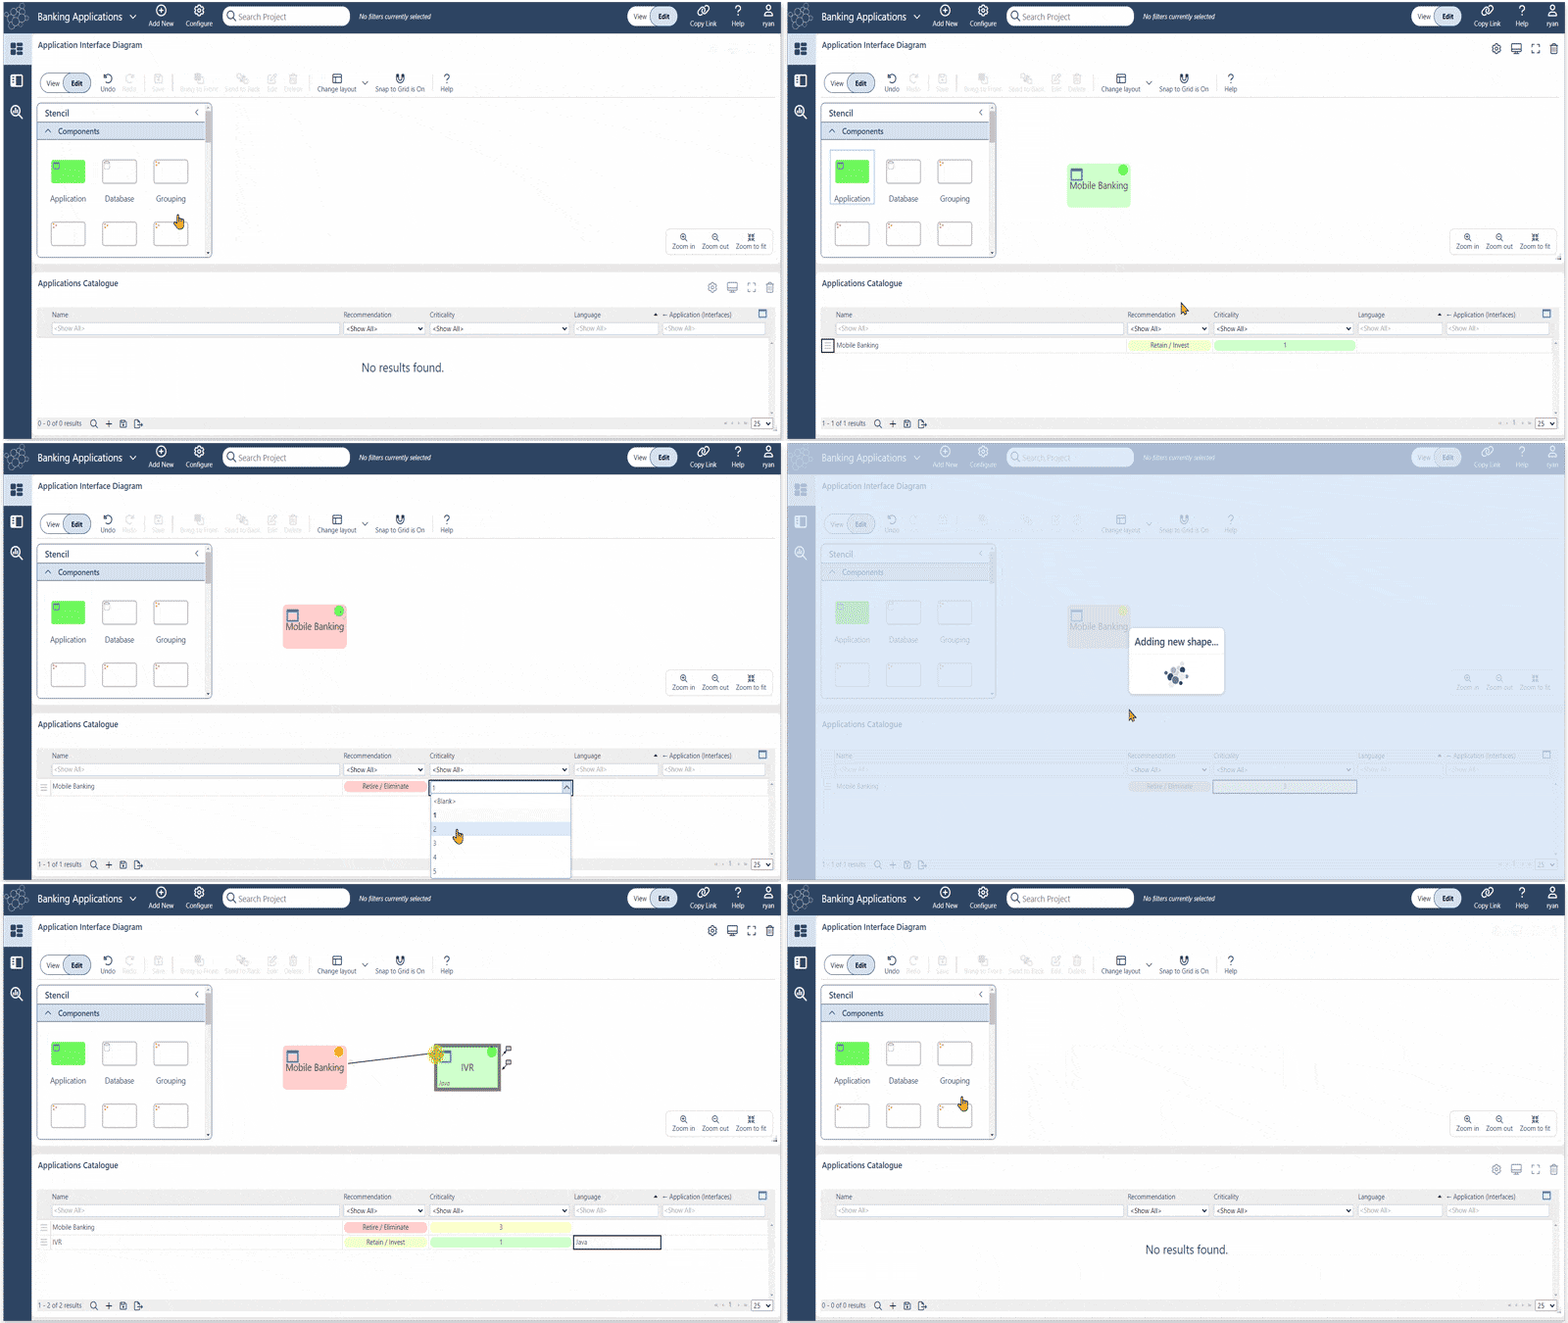
In the best enterprise architecture diagram tools, everything stays connected: data, diagrams and dashboards.
Import your Visio, UML, BPMN or other diagrams, shapes and flowcharts into your enterprise architecture tool. Wire them up to other elements in your architecture repository. Updates to diagram components will flow through automatically, with no need to revise tables, lists and other artefacts manually.
In ABACUS, diagramming functionality is native and properly integrated. Shape libraries, templates and standard frameworks are also available to speed up diagramming.
Automate Architecture Diagram Updates
For busy EAs this can save hours and days of time and effort:
- Map out network diagrams, application architectures, business architectures, information architectures, etc
- Document systems, IT processes and data flows
- Diagrams can be created automatically from structured data
- Share objects/elements across diagrams, maintaining consistency
- No need to draw and re-draw diagrams when data changes
- Updates flow through to stakeholder dashboards when data is edited
Build Architecture Diagrams Quickly
By combining diagram driven and data driven enterprise architecture, architects can move faster, offer more cost-efficient programs and most importantly track and measure business outcomes.
Many architects are familiar with the frustration caused when diagrams are included in architecture repositories or imported from external environments and tools only as “still images”. These images will likely be out of date before the next meeting and require repetitive manual updates for any changes.
Maintain Accurate Architecture Diagrams
In ABACUS, diagrams are interactive, dynamic and most importantly connected to real-time enterprise data (such as cost properties). Changes to the repository are automatically inherited in diagrams, ensuring diagrams and dashboards stay updated.
Diagrams can be sketched out using canvas-and-stencil and “drag-and-drop”. They can also be animated by cost data or technical data, underpinned by integrations with sources such as ServiceNow, SharePoint and CMDBs.
When aggregated up the layers of your architectures, these financial and technical metrics support well-informed data-driven decision making.


