
User Friendly Enterprise Architecture Modeling Tool
Quickly centralize data. Generate diagrams, reports and dashboards to lead discussions and planning:
- Connect Visio, UML and BPMN diagrams and Excel data so they stay linked
- Easily build and edit application & technology architectures, process models, etc. using canvas-and-stencil diagramming
- Use shape libraries and templates to speed up diagramming eg. AWS and Azure icons for cloud and solution architectures
- Map out current and future state architecture scenarios
- Create custom diagram types, using your own symbols, based on your organization’s modeling requirements.
- Frameworks, notations and standards available including TOGAF, ArchiMate, BPMN, NIST & Zachman.
Business Capability Models & Value Streams
Use business capabilities to manage change
- Import and integrate existing data on business unit functions and goals
- Model business capabilities and value streams
- Map business capabilities to Applications, Process, Technologies and other components
- Analyze dependencies and identify where redundancies and gaps exist
- Get started quickly with business capability standards and frameworks including TOGAF, BizBok and PCF (all available in ABACUS)
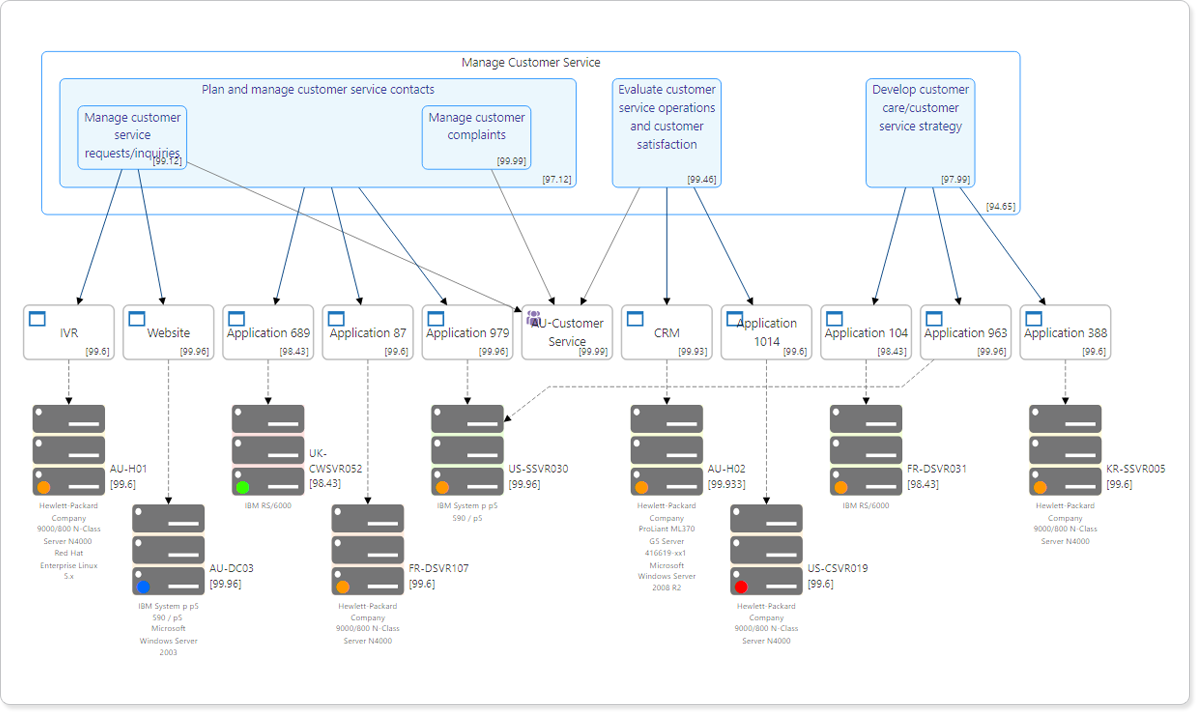
Quick Impact and Dependency Analysis with Graph View
Visualize and explore your organization’s architecture directly in your browser
- Map complex relationships: Discover and understand the connections between your systems and technologies with our intuitive graph view.
- Gain insights: Identify dependencies and potential impacts in seconds, to make informed decisions quickly
- Drill down for details: explore specific connections to uncover underlying complexities and dependencies
- Customize views: Choose from a range of icons and EA standards to tailor the graph view to your organization

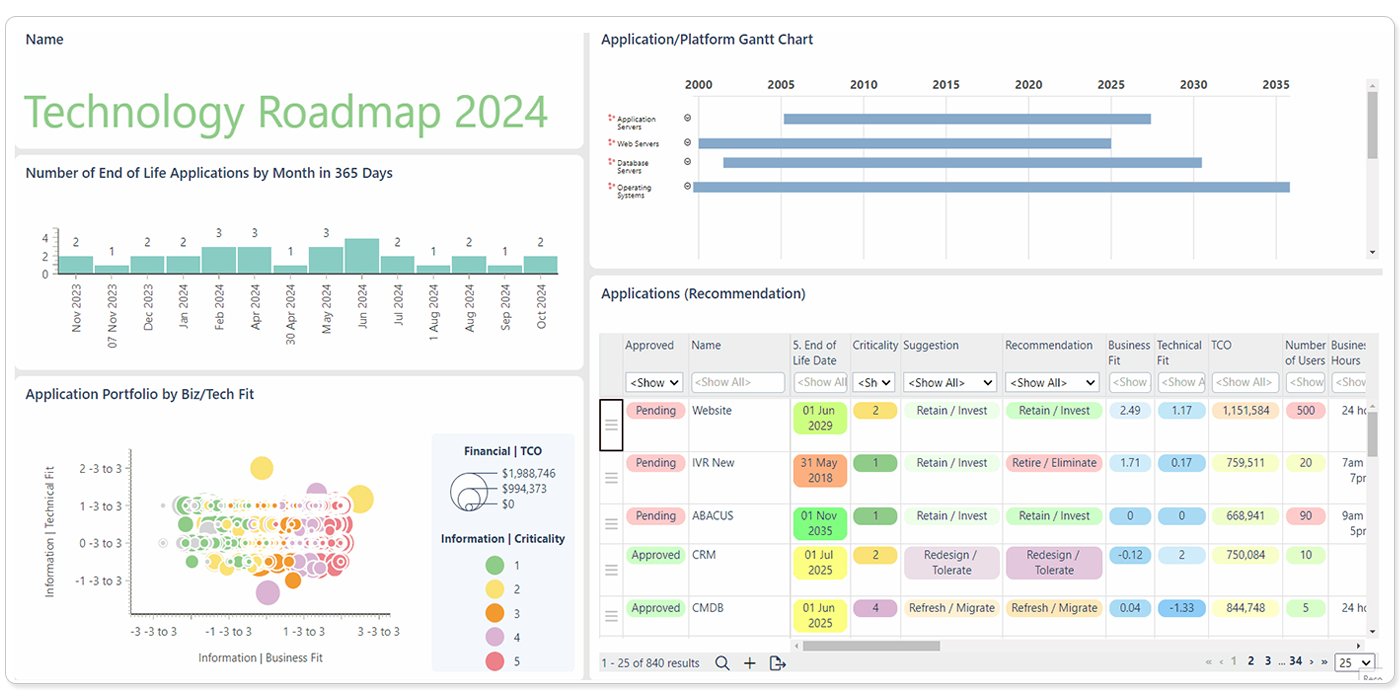
Enterprise Architecture Roadmaps
Bring your enterprise architecture roadmap to life with diagrams and visualizations
- Build architecture roadmaps: Use Gantt Charts and heatmaps to track timelines & key dates for projects, technologies, risks, and more.
- Track progress: identify the steps needed to reach your target state architecture. Monitor cost and technical metrics.
- Collaborate in real time: On data catalogs, charts, models and diagrams
- Customize dashboards: select the diagrams, charts, catalogs and content to communicate progress
Visual Filtering for Focused Insights
Quickly explain the impact of strategies, dependencies or future state options
- Zero in on subsets of operating processes, capabilities, and applications. Or filter according to properties such as cost and risk
- Provide an instant view of second order effects across all views and diagrams
- Highlight high-risk applications and then check in on key business process and business capability diagrams to understand dependencies
- Filter to focus: select processes which are being redesigned, or applications which are located in a particular country
Upgrade Your Architecture Modeling & Roadmapping
ABACUS is available on-premise, in the cloud or hybrid