“Business problems require quantifiable, contextual and actionable insights that provide enough value to justify an investment.”
– Gartner
One of the most useful skills when presenting information is to remove the noise. By focusing people’s attention on a select group of relevant metrics or KPIs, you can help them make confident decisions.
What is Data Driven Enterprise Architecture?
Within your Enterprise Architecture repository lies a wealth of valuable data. However, its potential often remains untapped without effective selection, filtering, processing and presentation. To do this efficiently, architects need to be able to roll up and manipulate data from across their architecture layers, stepping into a more strategic data-driven enterprise architecture role.
Algorithms: A More Efficient Data Analysis Tool
Architects can lighten this data-analysis workload and reduce the time spent on regular analysis tasks using enterprise architecture algorithms. This approach provides a far more efficient alternative to exporting to spreadsheets or other data analysis tools.
Algorithms automate routine calculations, allowing you to minimise time spent exporting and manipulating data for analysis, and focus on projects such as strategic planning. A win on the productivity and efficiency front.
Examples of common enterprise architecture metrics & KPIs include:
- Cost Calculations and TCO
- Status Recommendations such as TIME
- Business Fit & Technical Fit Scores
- Application Risk Scores
- Security Scores or Ratings
Architects can use algorithms to set up, schedule and trigger calculations, updating the metrics or KPIs on dashboards in seconds. These calculations are often a key part of progress reports needed to keep your colleagues well informed.

Automating Enterprise Architecture Change Analysis
Here are some examples of how algorithms can be used to automate enterprise architecture modeling, change analysis and gap analysis.
1. Status Recommendations
Using algorithms to quickly review and assess existing data is a powerful method to gain a quick snapshot of the business. For instance, the Gartner TIME status (Tolerate-Invest-Migrate-Eliminate) can be used to assess and report on the health and timeliness of an organization’s data architecture. Architects can present a heatmapped view of TIME recommendations in ABACUS dashboards, providing regular status updates at a glance.
2. Technology Cost Calculation Analysis Tools
Accurate technology cost predictions are essential to support financial forecasting. Architects can use ABACUS’ cost algorithms to calculate, aggregate or attribute costs:
- Total cost of ownership
- Acquisition costs
- Installation costs
- Support and maintenance costs
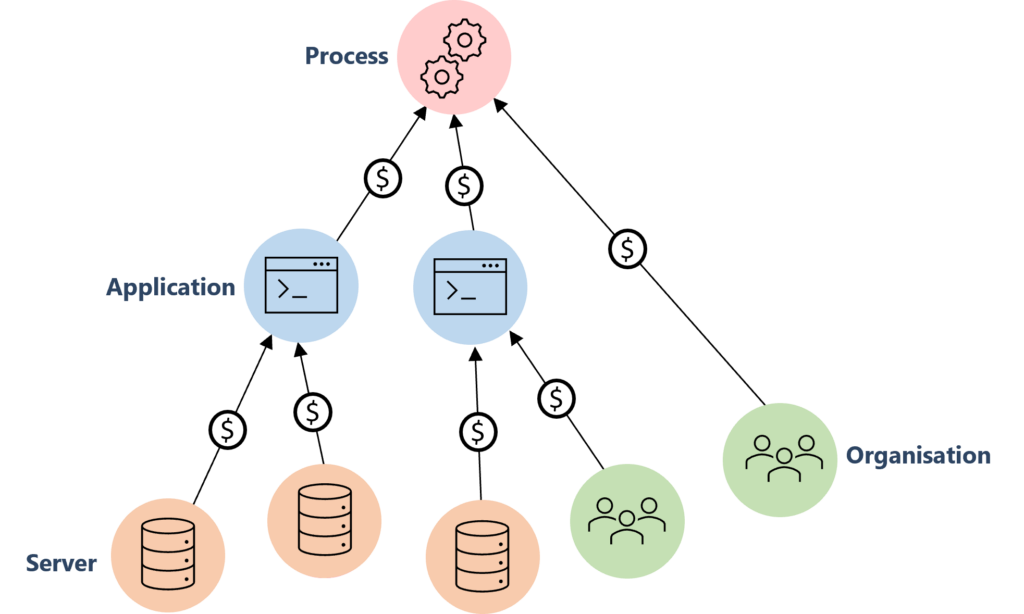
For instance, to provide an overview of the technology costs needed to run a specific line of business, architects can use algorithms to allocate the cost of applications to the departments which use them.
You can also analyze trends and predict and compare costs for future state architecture options.
3. Enterprise Architecture Analysis for Application Portfolio Management
How do you guide the best use of your organization’s resources? Scoring applications, systems, projects, and processes on a scale can be a very useful way to identify priorities.
For architects managing large application portfolios, using business fit and technical fit scores for resource allocation decisions is an efficient way to reduce waste and focus resources.
In the context of application rationalization, factors such as the type of application, number of users and cost per license are often included when calculating business and technical fit scores. Algorithms can be used to streamline these calculations and update them regularly. The results can be displayed in a simple bubble chart in easy-to-navigate dashboards to guide architecture recommendations.
4. Enterprise Security Architecture & Standards Reporting
From regulatory compliance to cybersecurity, many aspects of your organization’s operations are governed by industry standards.
Algorithms can help automate the security scores and ongoing reporting needed to track your organization’s adherence to these standards and highlight areas in need of improvement. A tool which readily calculates and presents quick assessments of your processes, will support your team in demonstrating strong compliance.
Enterprise Architecture at Work: Modeling, Communication & Analysis
Often data-driven enterprise architecture requires calculations to be adjusted or custom fit for your organization. Fortunately, this is straightforward to implement.
ABACUS’ No-Code Algorithms provide you with the freedom to create calculations with user-friendly, drag-and-drop functionality. If you need to build your own custom analytics or modify pre-built templates, ABACUS’ no-code algorithms are customizable. Tailor them to provide insights for the questions your teams ask most often.
It’s straightforward to get started. For instance, a simple “sum” calculation adds the values in two columns and presents the results of the calculation in a third. Users can then work on building out more detailed calculations if needed, using operations including multiply, divide, count, power and log.
Present the results of your calculations in a range of ways: display costs or percentages in dashboard portlets, or set up algorithms to use color to create a simple architecture roadmap. For instance, Red-Amber-Green can be used to indicate what is changing in a technology landscape diagram or a business capability map.
Architecture teams can begin with a small dataset and scale up as the enterprise architecture repository matures.

