
Data Visualization for Enterprise Architecture Teams
Connect and collaborate seamlessly with ABACUS browser-based dashboards. Allow decision makers to tap into real-time information on business and IT assets, processes and resources.
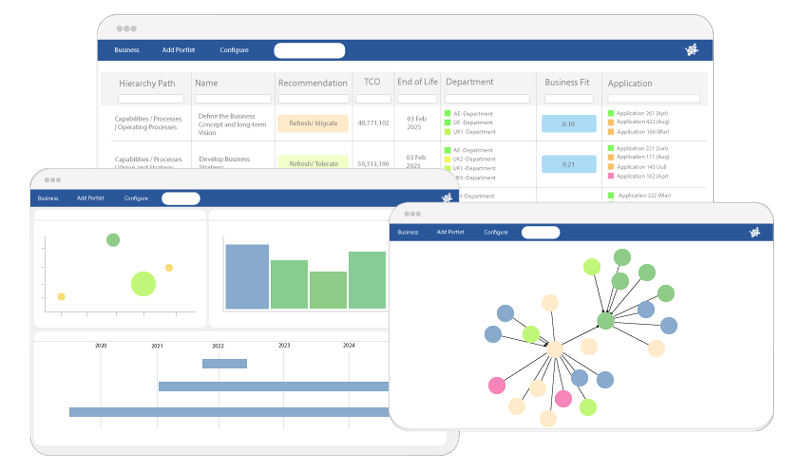
Modeling & Data Visualization
Display dynamic views of enterprise architecture models and diagrams
- Present analysis and plans to stakeholders with interactive Gantt Charts, Treemaps, Heatmaps, Capability Maps, Entity Relationship Diagrams, Graph View and other visualizations.
- Use pre-configured dashboards (e.g. PPM). Set up portlets to deliver cost analysis or other query-based results directly from your repository.
- Generate automated reports, roadmaps, KPI indicators, scorecards and timelines
- Teams can build and edit application & technology architectures, process models, etc. using canvas-and-stencil diagramming
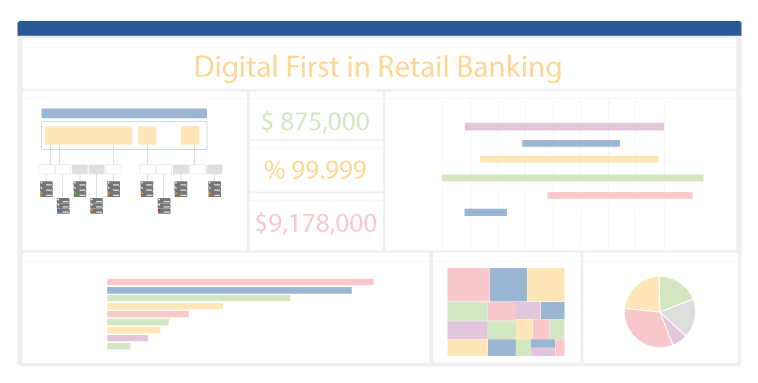
Enterprise Architecture Roadmaps & Collaboration
- Communicate about your business and technology roadmaps with interactive charts and diagrams (Pie, Bar, Gantt, Scatter, Capability Maps, Trade-Offs, Timelines, Sankey Diagrams, Graph View etc).
- Deliver query results and impact analysis live from your repository.
- Save filters in dashboard URLs, then provide these pre-filtered dashboards to focus stakeholders on important data.
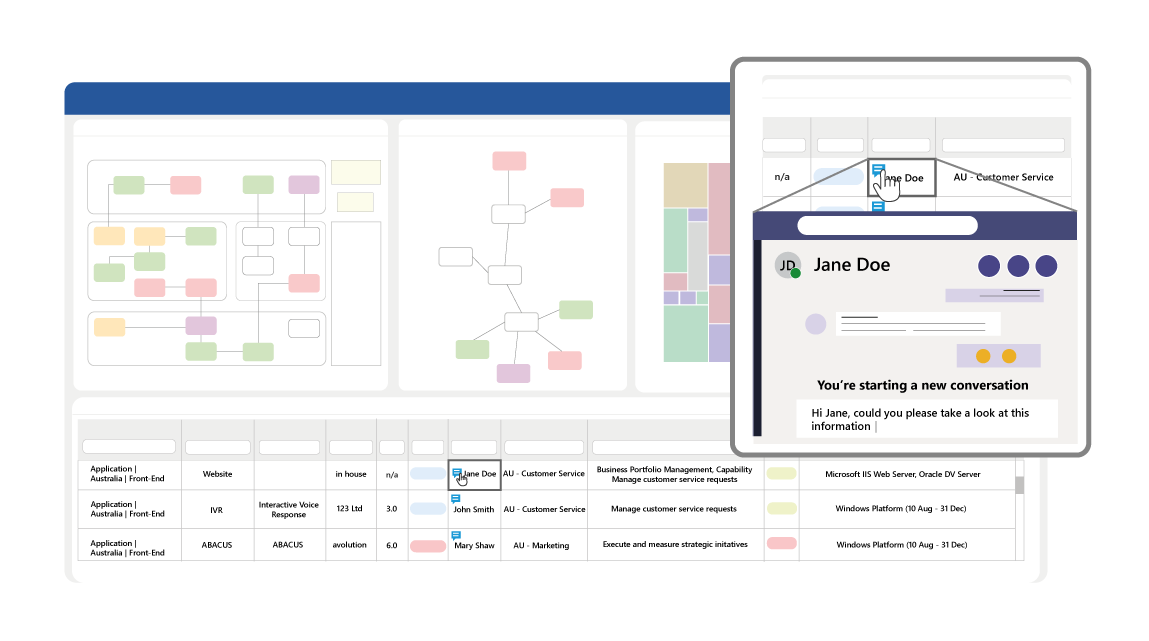
- Collaborate easily by initiating a conversation directly from a dashboard (embed with Teams, Skype or email).
For more information on Collaborative Data Management, click here.
Visual Filtering for Focused Insights
Zero in on subsets of operating processes, capabilities, and applications
- Filter according to properties such as cost and risk or provide an instant view of second order effects across all views and diagrams
- Highlight high-risk applications and then check in on key business process and business capability diagrams to understand dependencies
- Filter according to processes which are being redesigned, or applications which are located in a particular country

Model Enterprise Relationships with Graph View
“In Graph View we can select icons which are easy for our teams to understand”
- Understand connections: between your systems and technologies with our intuitive graph view.
- Gain insights: identify dependencies and potential impacts in seconds, to make informed decisions quickly
- Drill down for details: explore specific connections to uncover underlying complexities and dependencies
- Customize your view: choose from a range of icons and EA standards to tailor the graph view to your organization
Enterprise Architecture Reporting Best Practice
What’s the best way of showing our data? Persuade, gain buy-in and sign off from time-poor stakeholders.
The best enterprise architecture reporting makes complex data understandable, and allows your colleagues to quickly grasp the implications of your KPIs, and provide the feedback you need.