Being able to locate and understand the data resources in large enterprises gives a huge competitive advantage. Working out how to set up data stores so different regional teams can use it efficiently is a skillset needed in all organizations, and enterprise architects often lead the way.
Everything we do creates data. It’s estimated that a staggering 1.145 trillion MB of data is created each day including 306.4 billion emails, and 500 million Tweets.
With the average enterprise using somewhere between 850 and 1500 applications, including infrastructure catalogs, marketing, customer and financial databases and more.* – That’s a lot of data!
Although startling, these statistics are a good indication of how quickly data can build up. When poorly managed, large data volumes lead to high maintenance. However, when managed well your data can have many benefits. Helping organizations make informed decisions, quickly and confidently.
Here’s four steps towards effective data management and improved data visibility.
Step 1 – Centralization
Picture your data as pages of a book. If all the pages were spread across the floor in different places it would take a lot more time and effort to understand the full story. Data is no different. If all our data is spread across multiple applications it is going to take much longer to find what we’re looking for, with the added fear of missing key data at critical moments.
Centralizing data information, dataflows and processes into a single source of truth is the first step towards successful data management and maintenance. The good news is that using out-of-the box integrations and an open API helps remove the heavy-lifting of data centralization, creating a more seamless process.
Popular integrations may include:
- Roundtripping your data from Excel or Google Sheets
- Mapping to services such as Technopedia and ServiceNow
- Mapping to SharePoint lists – allowing you to harvest content and keep it updated
Step 2 – Identification
- What data exists?
- Who uses it? What’s it used for?
- Where’s the data held and who owns it?
- What format is the data in?
- Where are the dataflows and integrations which carry data?
- Does the data comply to any standards?
- How can we access it and ensure it stays current (e.g., via an API)
Data gathering can initiate an application “spring cleaning” process for your enterprise. You may be surprised at the number of redundant applications you discover. It’s also worth capturing information on which applications provide duplicate functionality.
Rationalizing applications can lead to significant cost savings. A recent survey found the average global company can save between 20% and 30% of its IT budget by retiring redundant applications.
Capturing and communicating this information regularly is important. Do this efficiently by keeping a record of the baseline architecture and the associated costs. This can be compared to a future or target state, and cost savings calculated.
Information gathering can also be crowdsourced and maintained regularly across the business using web-editable data catalogs and diagrams. In this way, architects don’t need to take on the role of data steward.
Step 3 – Collaborative Data Management
Allow and encourage users and teams across the enterprise to actively engage and maintain their own data.
Like any task, the easier it is for the user, the more likely it is that the task will get done. This rule also applies to effective self-service data management. Your application management data needs to be secure, accessible, and easy to manage.
ABACUS allows you to tailor and personalize data registers and catalogs in browser-based catalogs. Giving users the ability to quickly check-in on your organization’s data, in a user-friendly, collaborative environment.
Data-owners can self-manage asset lists and initiate chats directly from their dashboards. They can adjust the catalog design: adding, renaming and re-ordering columns, and sorting, changing widths and titles as they prefer.
Users across your enterprise can easily access and edit their data in real-time, improving data integrity, reliability, and productivity within the comfort of their browser. For further ease, ABACUS Enterprise can also be embedded as tabs into your chosen digital workspace i.e., Microsoft Teams or Confluence – providing an even more familiar environment.
Step 4 – Communication Through Visualization
The real value of centralized, well maintained data can be grasped when you have the right tools in place to understand and communicate about both the broad data landscape, and about the details.
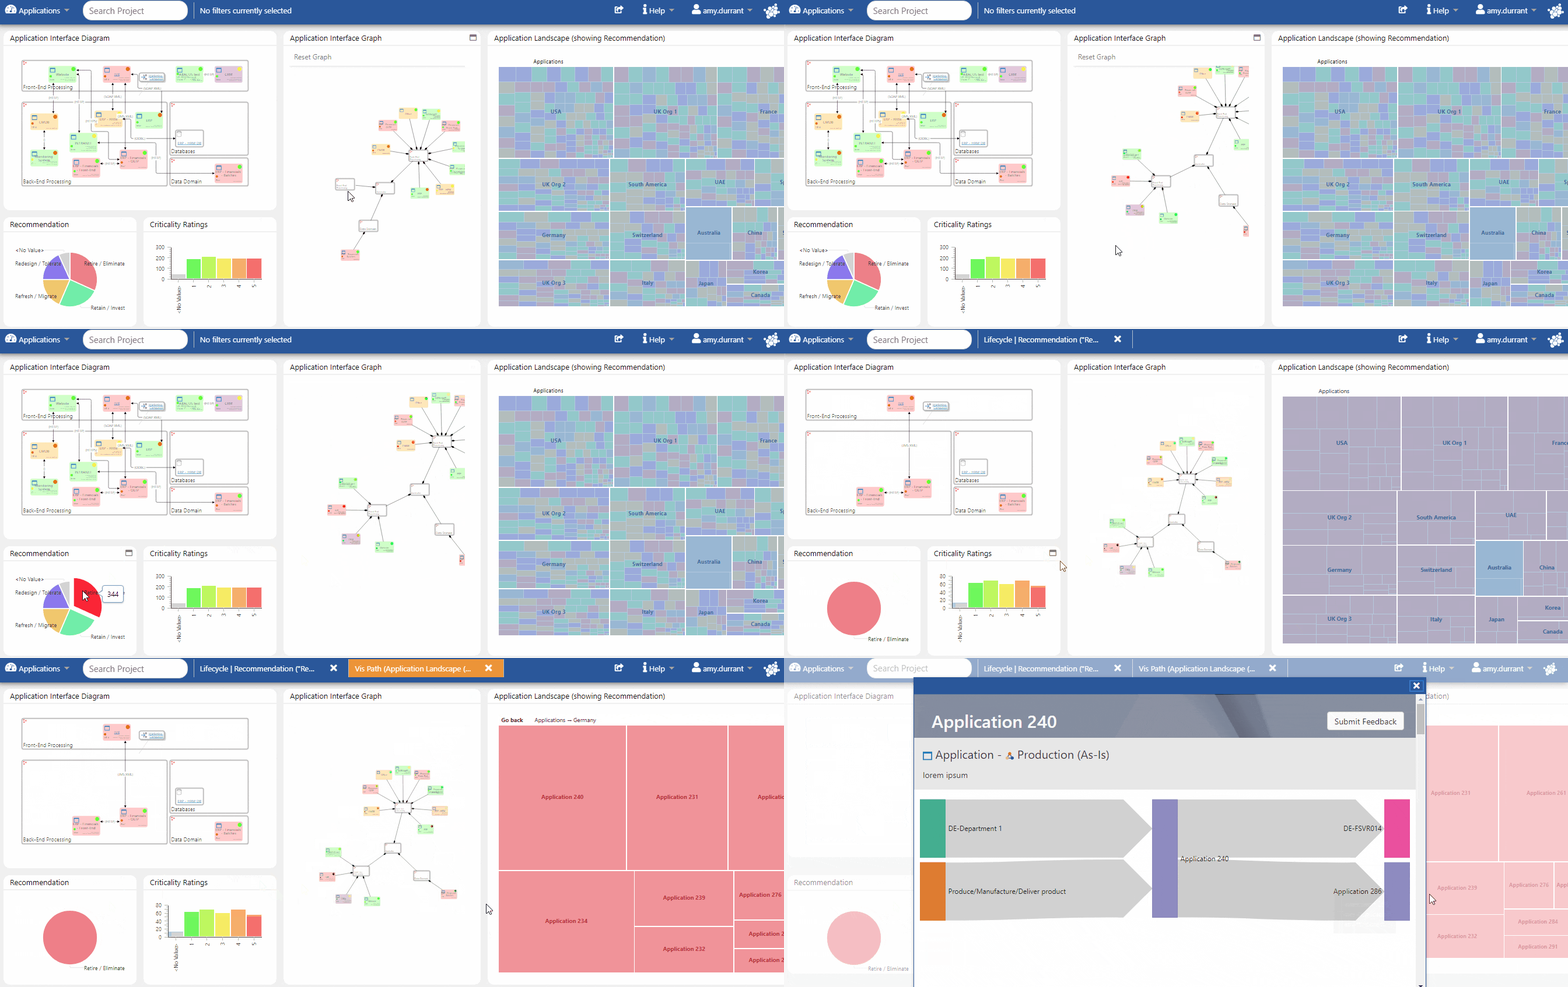
Personalized browser-based dashboards help you share data overviews and analysis whenever they’re needed. Instead of manually generated reports and PowerPoint decks, ABACUS Enterprise allows architects to choose a range of neat interactive visualizations, including pie and bar charts, KPIs and Graph View, presenting data clearly to stakeholders.

Image: Data is stored in ABACUS’ graph database. Users can navigate through the connections using Graph View
Dynamic dashboards give users the ability to easily drill-down and filter data at their leisure; providing valuable insights into key KPIs, identifying opportunities, and helping to reduce risk and costs.

Image: Visual filtering of data in ABACUS dashboards
All updates made in the repository (by data owners) appear in real-time in data visualizations, providing reassurance to stakeholders that their dashboards will always be accurate and up to date.
Email notifications and chat integrations can also be set-up to help keep teams engaged and connected.
Architects can bring everyday data within easy reach of the people who work with it most. This improves the ability of the whole organization to monitor, access, maintain and analyze data. Ultimately making what may now seem invisible, visible.
For more information on how ABACUS can help connect your enterprise, please speak to our team who will be more than happy to arrange a personalized demonstration.
Schedule a Demo
* [1] NetSpoke Cloud Report August 2019 – Average enterprise uses 1295 cloud apps . See also https://www.bmc.com/blogs/saas-growth-trends/
** [2] https://techjury.net/blog/how-much-data-is-created-every-day/#gref


